SGT Expert Eye

Which neighborhoods are trending?
​​​​​​​Who should list now?

Let’s find out by comparing 2021 year-to-date data to the prior year. We looked at Manhattan and parts of Brooklyn.

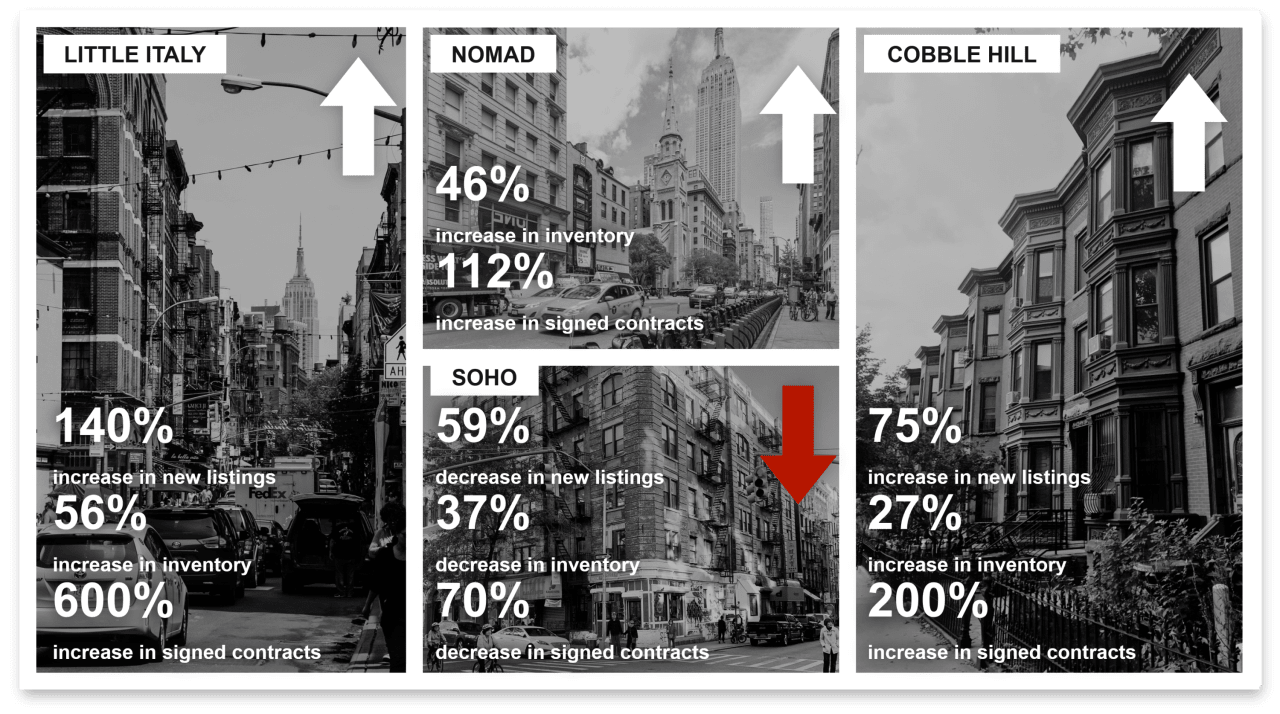
MORE INVENTORY = MORE SALES
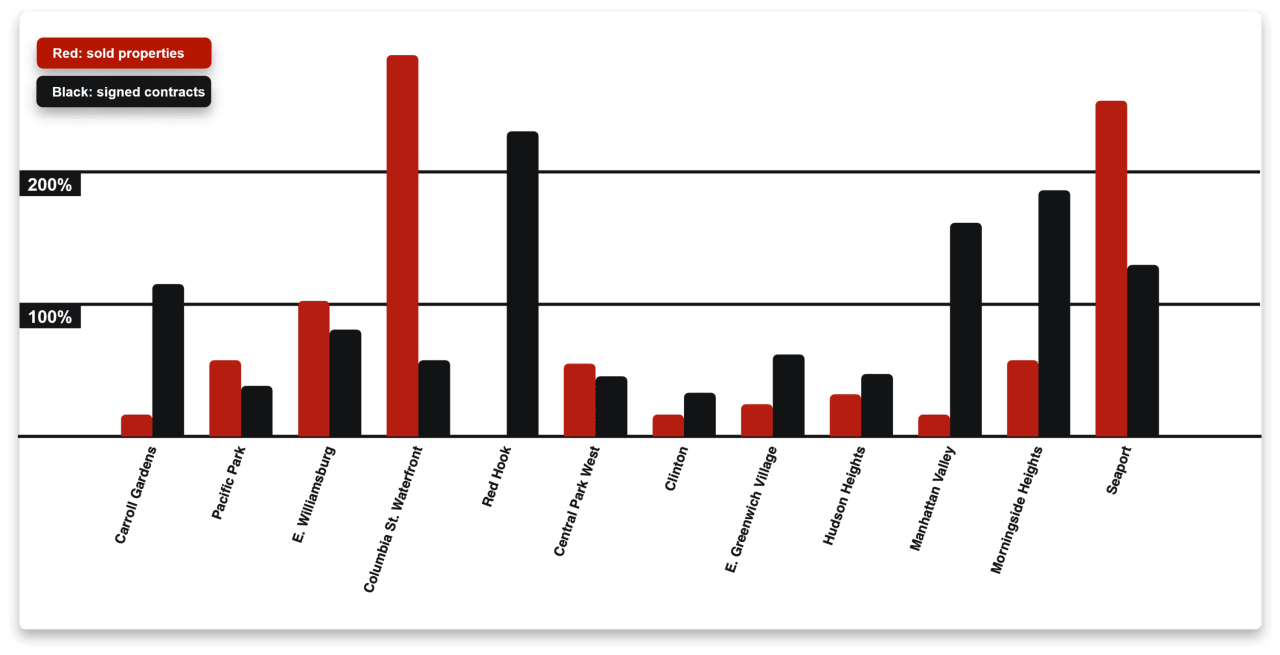
Bar chart comparing sold properties and signed contracts across 12 New York neighborhoods.

MORE INVENTORY = MORE SALES

Infographic comparing real estate market changes in Little Italy, NoMad, Cobble Hill, and SoHo.
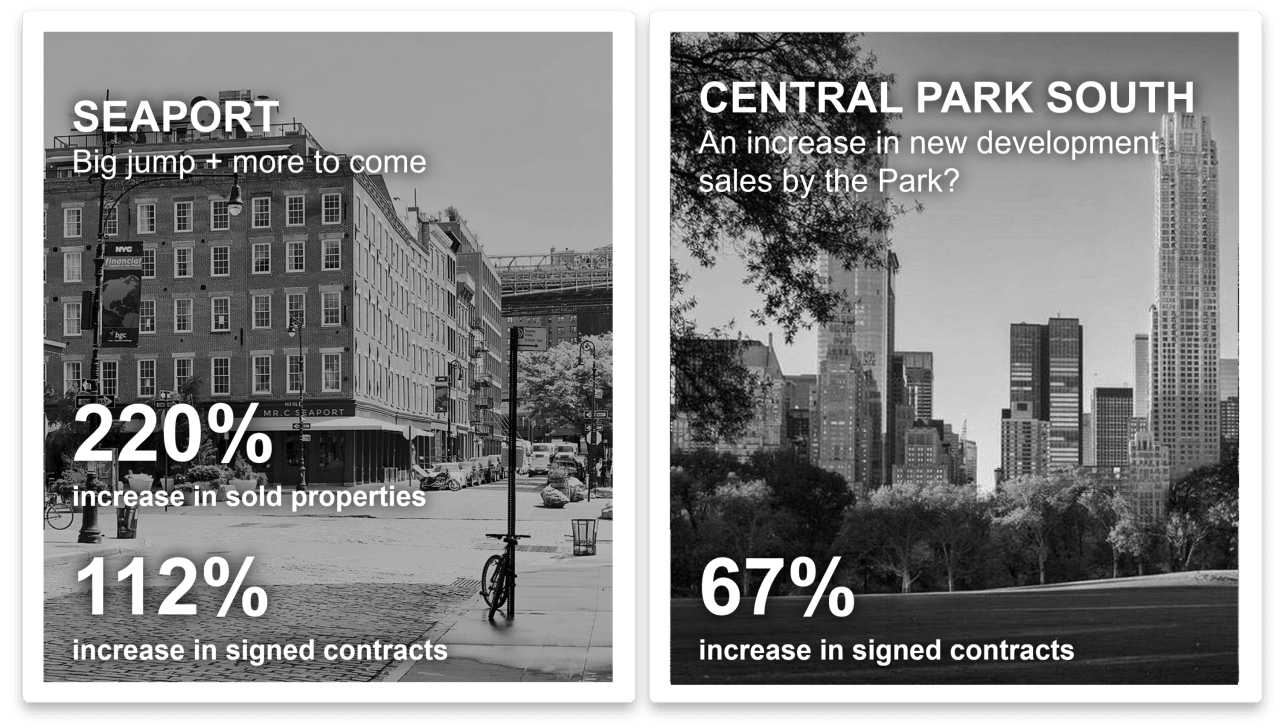
Real estate infographic: Seaport reports increases of 220% in sold properties and 112% in signed contracts; Central Park South, 67% in signed contracts.

Work With Us

Conducting each transaction based upon service, authenticity and integrity, we are built on lifelong relationships and value the client above all.